American Butterfly (Jan 2012 to Mid 2013)
1. The Theory of Every Business — (Jan to Sep 2012)
2. Spiritually Inspired Software — (Quantum Economics) — Oct 2012
3. The Network on a String — (Superstring Economics) — Nov 2012 to Jan 2013
4. The Butterfly — Utterly Incomplete and Very Rough — Jan to Apr 2013
MARS Resort 1 — The Return of ŔÉŚ — For Elon Musk — Oct 2017
Ripple Effects and Elephants for Paul G Allen — Jan 2018
The Villa Secrets Secret — 2014 to 2017
Complete Book — PDF
Online Version — Summary
Chapter 1.1.6 — S-Web — Our Solution
Chapter 2. The S-World Villa Secrets Network
Chapter 3. Mandates - Mandates - Mandates and Prestige Marketing
Chapter 4. The CDS — Content Distribution System
Chapter 6. The CRM Nudge AI™
Chapter 7. The TFS™ – Total Financial System
Chapter 8. Villa Secrets Property Managers and Owners
Chapter 9. S-World CRM-CC ™- The Company Controller
Chapter 10. S-World UCS™ Hawthorne
Angel Theory — Foundational Ideas — 2016
A New Theory of Everything for Michael Green — March 2016
M-System 3 — The Susskind Boost — March 2016
M-Systems 4 — The Peet Tent — March 2016 to 2017
M-Systems 14 — Angel Cities — May 2016
M-Systems 1 to 14 — Aug 1st 2016
M-Systems 1 to 8 — Aug 2016
S-World Angel Theory — The Sienna Foundation — Inspiration — Sep 2016
S-World — Experience Africa — Oct 2016
S-World dot biz and American Butterfly — Nov 2016
M-System 14 — Angel Cities and Special Projects — Nov 24th 2016
From M-Theory to M-Systems — Dec 2016
Angel Theory — Book — 2017 to 2021
M-Systems & Angel City 5 — The Movie — Aug 1st 2017
The E-TOE — The Economic Theory of Everything — Nov 2017
A Love Story and Theory of Everything — Nov 24th 2017
Ripple Effects and Elephants for Paul G Allen — Jan 2018
Angel Theory — The Economic Theory of Everything — Books — Feb 2018
Angel Theory — Paradigm Shift — April 2018
Supereconomics Book 2 — Š-ŔÉŚ™ Financial Engineering — 2012 to Feb 2020
Supereconomics Book 3 — 64 Reasons Why — Summary — 2019 to Feb 2020
Supereconomics Book 2 — S-RES and The City — May 2021
M-Systems — A More Creative Capitalism — 2016 to 2018
Inspiration — Bill Gates Harvard Commencement Speech — 2007
Ripple Effects and Elephants for Paul G Allen — Jan 2018
UCS™ History 1 - POP Super Coupling — The Green Symmetry — Feb 2018
A More Creative Capitalism — Summary — Apr 2018
A More Create Capitalism — A Good Model — Theoretical Physics — June 2018
A More Create Capitalism — Book — Apr to Oct 2018
S-World UCS™ Hawthorne — For Richard Thaler & David Hoffeld — June 2018
S-World BES™ — Behavioural Economic Systems — Malawi FC — July 2018
The Rodrik Conjecture with Ed Witten & Stephen Hawking — Aug 2018 (& July 2021)
A More Creative Capitalism — Chapter 4. The ŔÉŚ Equation — Oct 2018
Growth Theory versus Climate Change (The Elephant in the Room) — Nov 24 2018
The Momenent of Lift — A Message for Melinda French Gates — May 18 2021
American Butterfly 2012 — My First Economics Book in Four Parts — 2012 to 2013
Book 1 — The Theory of Every Business — Apr to Sep 2012
Book 1 — Ch 7 — T5. S-World VSN — S-World — Siennas World — Aug 2012
Book 1 — Ch 8 — T6. S-World UCS — In Game — (S-RES 1) — Sep 2012
Book 2 — Spiritually Inspired Software — Oct to Nov 2012
Book 2 — Ch 1 — The Entangled Butterfly (The PQS) — Oct 2012
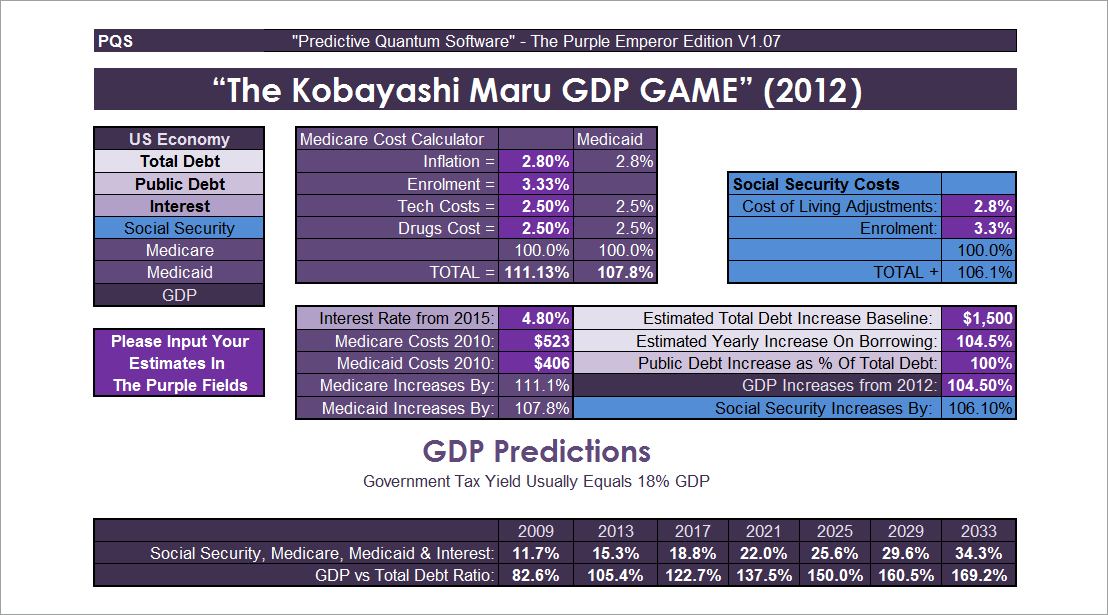
Book 2 — Ch 1g — Predictive Quantum Software — Oct 2012
Book 2 — Ch 2 — To Infinity and Back Again — Nov 2012
Book 2 — Ch 3 — Strings of Life — (S-RES 2) — Oct 2012
Book 3 — The Network On A String — Dec 2012
Book 3 — Ch 3 — Quantum Spin & the RES ⇔ Equation — (S-RES 3) — Dec 2012
Book 4 — A SWOT Analysis and The Butterfly — Jan to Apr 2013
Angel Theory — 2015 to 2017
AngelTheory.org
M-System 3. The Susskind Boost — Mar to May 2016
M-System 14 — Plus the Right Side Bar Menu — 25th May 2016
S-World Angel Theory — Inspiration — The Sienna Foundation — 9 Sep 2016
Dr Amanda Peet — From M-Theory to M-Systems — Dec 2016 to Jan 2017
An Introduction to M-Systems — 11 Apr 2017
★ M-Systems and Angel City 5 — The Movie — 1 Aug 2017
★ The E-TOE — An Economic Theory of Everything — IN 7 PARTS — Nov 2017
★ M-Systems — A Love Story and Theory of Everything — 24 Nov 2017
A More Creative Capitalism 1 — For Bill Gates — Mar 2016 to July 2018
The Susskind Boost (Ŝ) M-System 3 | 7★ | T2 T8 T10 (27 Mar 2016 - 10 Jun 2021)
The PQS — Predictive Quantum Software — 1st August 2016
M-Systems — A Digital Theory of Everything — 4 Dec 2016 to 10 Apr 2017
M-System 15 — Angel POP & The E-TOE — 18 Aug 2017
Angel Theory — Paradigm Shift — Out of Chaos — Aug to Nov 2017
Angel City 5 — The Movie — 1 Aug 2017
M-Systems Summary — MARS Resort 1 — RES — Trustees — 3 Nov 2017
M-Systems & Special Projects — A Love Story and Theory of Everything — 24 Nov 2017
Ripple Effects and Elephants for Paul G. Allen — 30 Jan 2018
A More Creative Capitalism for Bill & Melinda Gates — Summary — 24 Apr to 26 Jun 2018
A More Creative Capitalism for Bill Gates — Theoretical Physics Summary — 28 Jul 2018
A More Creative Capitalism 2 — For Bill Gates — 9 Jun to 24 Nov 2018
A More Creative Capitalism for Bill & Melinda Gates — Book — 1 Aug to 20 Oct 2018
S-World UCS Hawthorne — For Richard Thaler — 9 to 20 Jun 2018
S-World BES - Behavioural Economic Systems — 20 Jul 2018
The Rodrik Conjecture — 31 Aug 2018 to 2 Jul 2021
Chapter 4. The RES Equation — 23 Sep to 19 Oct 2018
Growth Theory - Climate Change and Charter Cities — 12 to 21 Nov 2018
Growth Theory versus Climate Change — 24 Nov 2018
Supereconomics (SuEc) — 2018 to 2020
www.SuperEconomics.Ai — Supereconomics is SuEc — 2018 to 2020
★ Angel Theory - Paradigm Shift — Summary — 2018
AT Paradigm Shift — ŔÉŚ Supereconomics — 29 May 2018
AT Paradigm Shift — A Good Model — The ŔÉŚ Equation — 10 Oct 2018
SuEc Book 3 Sixty-Four Reasons Why — Summary — Aug 2019 to Feb 2020
★ SuEc 3 Sixty-Four Reasons Why — Summary — For Kate Raworth — Feb 2020
★ SuEc Book 2 — THE HOW — Š-ŔÉŚ™ Financial Engineering — Feb 2020
SuEc Book 3 - Sixty-Four Reasons Why — 2020
SuEc Book III (09.91) — 64 Reasons Why — Complete Book — Dec 2018 to Oct 2020
SuEc Book III (10.50) — 64 Reasons Why — Summary — Sep 2019 to Mar 2020
(10.50) Summary — Part 1 — THE WHAT — S-World Angelwing Introduction
(10.50) Summary — Part 1 — THE HOW — Š-ŔÉŚ Financial Engineering
(10.50) Summary — Part 3 — A Good Model & The Feynman Sum Over Histories
(10.50) Summary — Part 4 — Internalities and Net Zero DCA
(10.50) Summary — Part 5a — Special Projects 1 to 33
(10.50) Summary — Part 5b — Special Projects 34 to 71
SuEc Book III (11.44) — 64 Reasons Why — BASIC — 24 Nov 2020 to 18 Feb 2021
S-RES Foundational Ideas — 2012 to 2016
AB 1 — Chapter 7 — Sienna’s World — S-World
AB 1 — Chapter 8 — S-World Universal Colonization Simulator — 2012
AB 2 — Chapter 1. The Entangled Butterfly — 2012
AB 2 — Chapter 3 — Strings of Life — 2012
AB 2 — Chapter 3 — Part 12. Quantum Force Theory (RES) — 2012
AB 3 — Chapter 3 — Quantum Force Theory, Spin & the RES ⇔ Equation — 2012
The Susskind Boost (Ŝ) M-System 3 — 2016
The PQS — Predictive Quantum Software — M-Systems 1 to 14 — Aug 1st 2016
A Digital Theory of Everything — M-Systems 1 to 8 — Aug 2016
M-System 10. RES — The Clinton-Trump Equation — 2016
The E-TOE Chapter 2 — The flap of A Butterfly’s Wings — Dec 13 2017
09.60__ The ŔÉŚ Equation — High-Octane Financial Engineering — Jan 2019
RES Video 25 — RES v4.14 - Manual Display - Ad Libbed — Dec 27 2022
RES Video 27) RRT and ŔÉŚ Software Design Summary — Jan 13 2019
S-RES Foundational Ideas — 2017
M-Systems - Sixteen One Page Illustrated Summaries — Jan 2017
M Systems — A Digital Theory of Everything — Apr 2017
The E-TOE Chapter 2 — The Flap of a Butterfly’s Wings — 2017
The E-TOE Chapter 3 — The Network on a String — Nov 15 2017
The E-TOE Chapter 4 — Super Coupling — Nov 19 2017
The E-TOE Chapter 5 — Quantum Time — Nov 19 2017
The E-TOE Chapter 6 — Relative Equality — Nov 19 2017
The S-World UCS™ M-Systems — 24 Nov 2017
M-Theory to M-Systems — A Love Story and Theory of Everything — Nov 24 2017
An Ecological and Philanthropic Theory of Everything plus Space — Nov 24 2017
S-WORLD
- START
-
Books 1
- S-World 2011 to 2021 — Books and Papers Index — Mid 2021
- American Butterfly (Jan 2012 to Mid 2013)
- 1. The Theory of Every Business — (Jan to Sep 2012)
- 2. Spiritually Inspired Software — (Quantum Economics) — Oct 2012
- 3. The Network on a String — (Superstring Economics) — Nov 2012 to Jan 2013
- 4. The Butterfly — Utterly Incomplete and Very Rough — Jan to Apr 2013
- MARS Resort 1 — The Return of ŔÉŚ — For Elon Musk — Oct 2017
- Ripple Effects and Elephants for Paul G Allen — Jan 2018
- The Villa Secrets Secret — 2014 to 2017
- Complete Book — PDF
- Online Version — Summary
- Chapter 1.1.6 — S-Web — Our Solution
- Chapter 2. The S-World Villa Secrets Network
- Chapter 3. Mandates - Mandates - Mandates and Prestige Marketing
- Chapter 4. The CDS — Content Distribution System
- Chapter 6. The CRM Nudge AI™
- Chapter 7. The TFS™ – Total Financial System
- Chapter 8. Villa Secrets Property Managers and Owners
- Chapter 9. S-World CRM-CC ™- The Company Controller
- Chapter 10. S-World UCS™ Hawthorne
- Angel Theory — Foundational Ideas — 2016
- A New Theory of Everything for Michael Green — March 2016
- M-System 3 — The Susskind Boost — March 2016
- M-Systems 4 — The Peet Tent — March 2016 to 2017
- M-Systems 14 — Angel Cities — May 2016
- M-Systems 1 to 14 — Aug 1st 2016
- M-Systems 1 to 8 — Aug 2016
- S-World Angel Theory — The Sienna Foundation — Inspiration — Sep 2016
- S-World — Experience Africa — Oct 2016
- S-World dot biz and American Butterfly — Nov 2016
- M-System 14 — Angel Cities and Special Projects — Nov 24th 2016
- From M-Theory to M-Systems — Dec 2016
- Angel Theory — Book — 2017 to 2021
- M-Systems & Angel City 5 — The Movie — Aug 1st 2017
- The E-TOE — The Economic Theory of Everything — Nov 2017
- A Love Story and Theory of Everything — Nov 24th 2017
- Ripple Effects and Elephants for Paul G Allen — Jan 2018
- Angel Theory — The Economic Theory of Everything — Books — Feb 2018
- Angel Theory — Paradigm Shift — April 2018
- Supereconomics Book 2 — Š-ŔÉŚ™ Financial Engineering — 2012 to Feb 2020
- Supereconomics Book 3 — 64 Reasons Why — Summary — 2019 to Feb 2020
- Supereconomics Book 2 — S-RES and The City — May 2021
- M-Systems — A More Creative Capitalism — 2016 to 2018
- Inspiration — Bill Gates Harvard Commencement Speech — 2007
- Ripple Effects and Elephants for Paul G Allen — Jan 2018
- UCS™ History 1 - POP Super Coupling — The Green Symmetry — Feb 2018
- A More Creative Capitalism — Summary — Apr 2018
- A More Create Capitalism — A Good Model — Theoretical Physics — June 2018
- A More Create Capitalism — Book — Apr to Oct 2018
- S-World UCS™ Hawthorne — For Richard Thaler & David Hoffeld — June 2018
- S-World BES™ — Behavioural Economic Systems — Malawi FC — July 2018
- The Rodrik Conjecture with Ed Witten & Stephen Hawking — Aug 2018 (& July 2021)
- A More Creative Capitalism — Chapter 4. The ŔÉŚ Equation — Oct 2018
- Growth Theory versus Climate Change (The Elephant in the Room) — Nov 24 2018
- The Momenent of Lift — A Message for Melinda French Gates — May 18 2021
- SuEc Book 2 — THE HOW — Š-ŔÉŚ™
-
Websites
- Cape Villas.com — 2000
- Experience Africa.com — 2009
- The Spartan Theory — Badly Presented but Good Ideas — 2011
- American Butterfly.org — 2012 to 2013
- Angel Theory — 2016 to 2019
- Super Economics.ai — 2020 to 2021
- S-Web™ 5.1 Websites — Part 1 — 2022
- S-Web™ 5.1 Websites — Part 2 — 2022
- For S-Web™ 5.2 Websites — See t10t.org Dropdown — 2022
- T1. S-Web.org — (Login Required) — 2022
- The 10 Technologies — (Login Required) — 2022
- Nick Ray Ball.com — 2022
-
Economics
- American Butterfly 2012 — My First Economics Book in Four Parts — 2012 to 2013
- Book 1 — The Theory of Every Business — Apr to Sep 2012
- Book 1 — Ch 7 — T5. S-World VSN — S-World — Siennas World — Aug 2012
- Book 1 — Ch 8 — T6. S-World UCS — In Game — (S-RES 1) — Sep 2012
- Book 2 — Spiritually Inspired Software — Oct to Nov 2012
- Book 2 — Ch 1 — The Entangled Butterfly (The PQS) — Oct 2012
- Book 2 — Ch 1g — Predictive Quantum Software — Oct 2012
- Book 2 — Ch 2 — To Infinity and Back Again — Nov 2012
- Book 2 — Ch 3 — Strings of Life — (S-RES 2) — Oct 2012
- Book 3 — The Network On A String — Dec 2012
- Book 3 — Ch 3 — Quantum Spin & the RES ⇔ Equation — (S-RES 3) — Dec 2012
- Book 4 — A SWOT Analysis and The Butterfly — Jan to Apr 2013
- Angel Theory — 2015 to 2017
- AngelTheory.org
- M-System 3. The Susskind Boost — Mar to May 2016
- M-System 14 — Plus the Right Side Bar Menu — 25th May 2016
- S-World Angel Theory — Inspiration — The Sienna Foundation — 9 Sep 2016
- Dr Amanda Peet — From M-Theory to M-Systems — Dec 2016 to Jan 2017
- An Introduction to M-Systems — 11 Apr 2017
- ★ M-Systems and Angel City 5 — The Movie — 1 Aug 2017
- ★ The E-TOE — An Economic Theory of Everything — IN 7 PARTS — Nov 2017
- ★ M-Systems — A Love Story and Theory of Everything — 24 Nov 2017
- A More Creative Capitalism 1 — For Bill Gates — Mar 2016 to July 2018
- The Susskind Boost (Ŝ) M-System 3 | 7★ | T2 T8 T10 (27 Mar 2016 - 10 Jun 2021)
- The PQS — Predictive Quantum Software — 1st August 2016
- M-Systems — A Digital Theory of Everything — 4 Dec 2016 to 10 Apr 2017
- M-System 15 — Angel POP & The E-TOE — 18 Aug 2017
- Angel Theory — Paradigm Shift — Out of Chaos — Aug to Nov 2017
- Angel City 5 — The Movie — 1 Aug 2017
- M-Systems Summary — MARS Resort 1 — RES — Trustees — 3 Nov 2017
- M-Systems & Special Projects — A Love Story and Theory of Everything — 24 Nov 2017
- Ripple Effects and Elephants for Paul G. Allen — 30 Jan 2018
- A More Creative Capitalism for Bill & Melinda Gates — Summary — 24 Apr to 26 Jun 2018
- A More Creative Capitalism for Bill Gates — Theoretical Physics Summary — 28 Jul 2018
- A More Creative Capitalism 2 — For Bill Gates — 9 Jun to 24 Nov 2018
- A More Creative Capitalism for Bill & Melinda Gates — Book — 1 Aug to 20 Oct 2018
- S-World UCS Hawthorne — For Richard Thaler — 9 to 20 Jun 2018
- S-World BES - Behavioural Economic Systems — 20 Jul 2018
- The Rodrik Conjecture — 31 Aug 2018 to 2 Jul 2021
- Chapter 4. The RES Equation — 23 Sep to 19 Oct 2018
- Growth Theory - Climate Change and Charter Cities — 12 to 21 Nov 2018
- Growth Theory versus Climate Change — 24 Nov 2018
- Supereconomics (SuEc) — 2018 to 2020
- www.SuperEconomics.Ai — Supereconomics is SuEc — 2018 to 2020
- ★ Angel Theory - Paradigm Shift — Summary — 2018
- AT Paradigm Shift — ŔÉŚ Supereconomics — 29 May 2018
- AT Paradigm Shift — A Good Model — The ŔÉŚ Equation — 10 Oct 2018
- SuEc Book 3 Sixty-Four Reasons Why — Summary — Aug 2019 to Feb 2020
- ★ SuEc 3 Sixty-Four Reasons Why — Summary — For Kate Raworth — Feb 2020
- ★ SuEc Book 2 — THE HOW — Š-ŔÉŚ™ Financial Engineering — Feb 2020
- SuEc Book 3 - Sixty-Four Reasons Why — 2020
- SuEc Book III (09.91) — 64 Reasons Why — Complete Book — Dec 2018 to Oct 2020
- SuEc Book III (10.50) — 64 Reasons Why — Summary — Sep 2019 to Mar 2020
- (10.50) Summary — Part 1 — THE WHAT — S-World Angelwing Introduction
- (10.50) Summary — Part 1 — THE HOW — Š-ŔÉŚ Financial Engineering
- (10.50) Summary — Part 3 — A Good Model & The Feynman Sum Over Histories
- (10.50) Summary — Part 4 — Internalities and Net Zero DCA
- (10.50) Summary — Part 5a — Special Projects 1 to 33
- (10.50) Summary — Part 5b — Special Projects 34 to 71
- SuEc Book III (11.44) — 64 Reasons Why — BASIC — 24 Nov 2020 to 18 Feb 2021
- SuEc Book 2 - Š-ŔÉŚ and The City — 27 Dec 2018 to 9 Apr 2021
- SuEc Book 2 - Š-ŔÉŚ Videos — 2019 to 2021
- SuEc Book 2 - Š-ŔÉŚ™2021—⌂≥ÉL
- SuEc Book 1. The 10 Technologies — 2022
- American Butterfly 2012 — My First Economics Book in Four Parts — 2012 to 2013
-
t10t
- T10T.org — The 10 Technologies
- T1. S-Web™ — Everything Online — Home of 60,000x
- T2. The TBS™ — Total Business Systems
- T3. Networks and Distribution — Villa Secrets Networks
- T4. S-World Film — Film | Music | PR | Behavioral Sciences
- T5. S-World VSN™ — Virtual Social Network
- T6. S-World UCS™ — Gamify the Network
- T7. Š-ŔÉŚ™2021—⌂≥ÉL — Determined (Monopoly) Economics
- T8. Net-Zero DCA Soft — Dynamic Comparative Advantage
- T9. Grand Śpin Networks — S-World Cities
- T10. 10x Our Future — S-World Angelwing Combinatorial as-if AGI
- The 10 Technologies — Advanaced
- S-World — Sienna's World — Main Presentation Website
-
T7 S-RES
- S-RES Foundational Ideas — 2012 to 2016
- AB 1 — Chapter 7 — Sienna’s World — S-World
- AB 1 — Chapter 8 — S-World Universal Colonization Simulator — 2012
- AB 2 — Chapter 1. The Entangled Butterfly — 2012
- AB 2 — Chapter 3 — Strings of Life — 2012
- AB 2 — Chapter 3 — Part 12. Quantum Force Theory (RES) — 2012
- AB 3 — Chapter 3 — Quantum Force Theory, Spin & the RES ⇔ Equation — 2012
- The Susskind Boost (Ŝ) M-System 3 — 2016
- The PQS — Predictive Quantum Software — M-Systems 1 to 14 — Aug 1st 2016
- A Digital Theory of Everything — M-Systems 1 to 8 — Aug 2016
- M-System 10. RES — The Clinton-Trump Equation — 2016
- The E-TOE Chapter 2 — The flap of A Butterfly’s Wings — Dec 13 2017
- 09.60__ The ŔÉŚ Equation — High-Octane Financial Engineering — Jan 2019
- RES Video 25 — RES v4.14 - Manual Display - Ad Libbed — Dec 27 2022
- RES Video 27) RRT and ŔÉŚ Software Design Summary — Jan 13 2019
- S-RES Foundational Ideas — 2017
- M-Systems - Sixteen One Page Illustrated Summaries — Jan 2017
- M Systems — A Digital Theory of Everything — Apr 2017
- The E-TOE Chapter 2 — The Flap of a Butterfly’s Wings — 2017
- The E-TOE Chapter 3 — The Network on a String — Nov 15 2017
- The E-TOE Chapter 4 — Super Coupling — Nov 19 2017
- The E-TOE Chapter 5 — Quantum Time — Nov 19 2017
- The E-TOE Chapter 6 — Relative Equality — Nov 19 2017
- The S-World UCS™ M-Systems — 24 Nov 2017
- M-Theory to M-Systems — A Love Story and Theory of Everything — Nov 24 2017
- An Ecological and Philanthropic Theory of Everything plus Space — Nov 24 2017
- S-RES — MARS Resort 1 - The Return of RES — 2017
- S-RES Development — 2017 to 2019
- S-RES Foundational Ideas — 2012 to 2016
-
Cape Villas™
- CapeVillas.com — Website Homepage
- Cape Villas™ — CEO Nick Ray Ball — Contact
- Cape Villas™ — Best of Cape Town — Portfolio Page
- Cape Villas™ — Best of Africa — Villas and Safaris Portfolio Page
- Cape Villas™ — Villas by World Leading Architect Stefan Antoni
- Cape Villas™ — Private-Islands
- Cape Villas™ — Cape Town Villas Near the Beach
- Supereconomics (SuEc) Book 3 Sixty-Four Reasons Why — Summary — Aug 2019 to 2020
- Cape Villas™ — 1999 to 2022